Power BI · Swine Production
Swine Analytics Dashboard
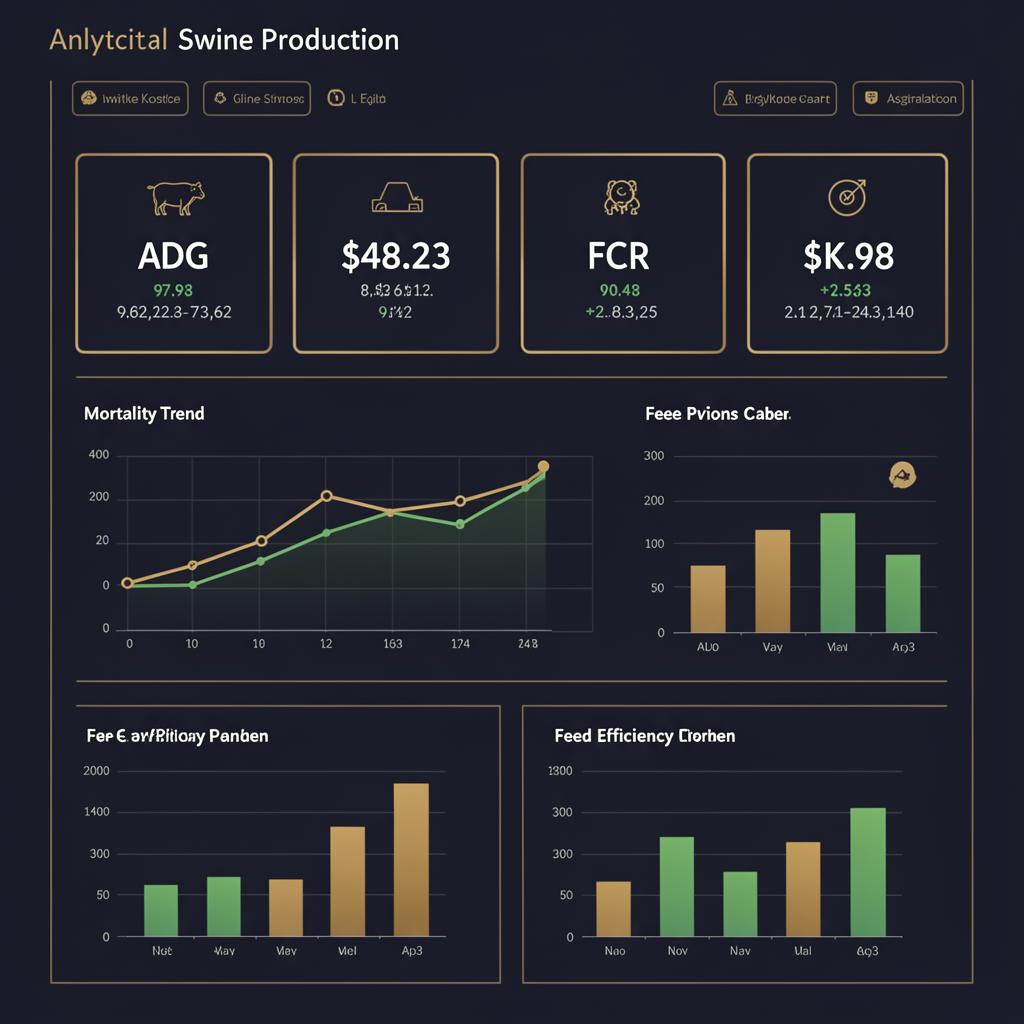
A unified Power BI dashboard for a commercial pig operation — turning daily weights, feed records and mortality logs into one decision-grade view.
The Problem
- Production data scattered across feed sheets, weighing books and mortality logs.
- No single source of truth for ADG, FCR or barn-level mortality trends.
- Owners and nutritionists making feed and pricing decisions without real numbers.
The Approach
- Audited existing data sources and standardized the daily capture template.
- Built a Power BI data model linking growth, intake, ration cost and mortality.
- Designed barn-, batch- and farm-level KPI views with traffic-light alerts.
- Trained the farm team on daily entry discipline and weekly review cadence.
Key KPIs Tracked
ADG
Average Daily Gain by batch & barn
FCR
Feed Conversion Ratio vs. target
Mortality
Weekly trend & cause split
Feed Efficiency
Cost per kg of gain
Results
- Single executive view replaces 6+ spreadsheets.
- Underperforming barns identified within days, not months.
- Feed cost per kg of gain visible in real time for ration decisions.
Have a similar challenge?