Power BI · Poultry Production
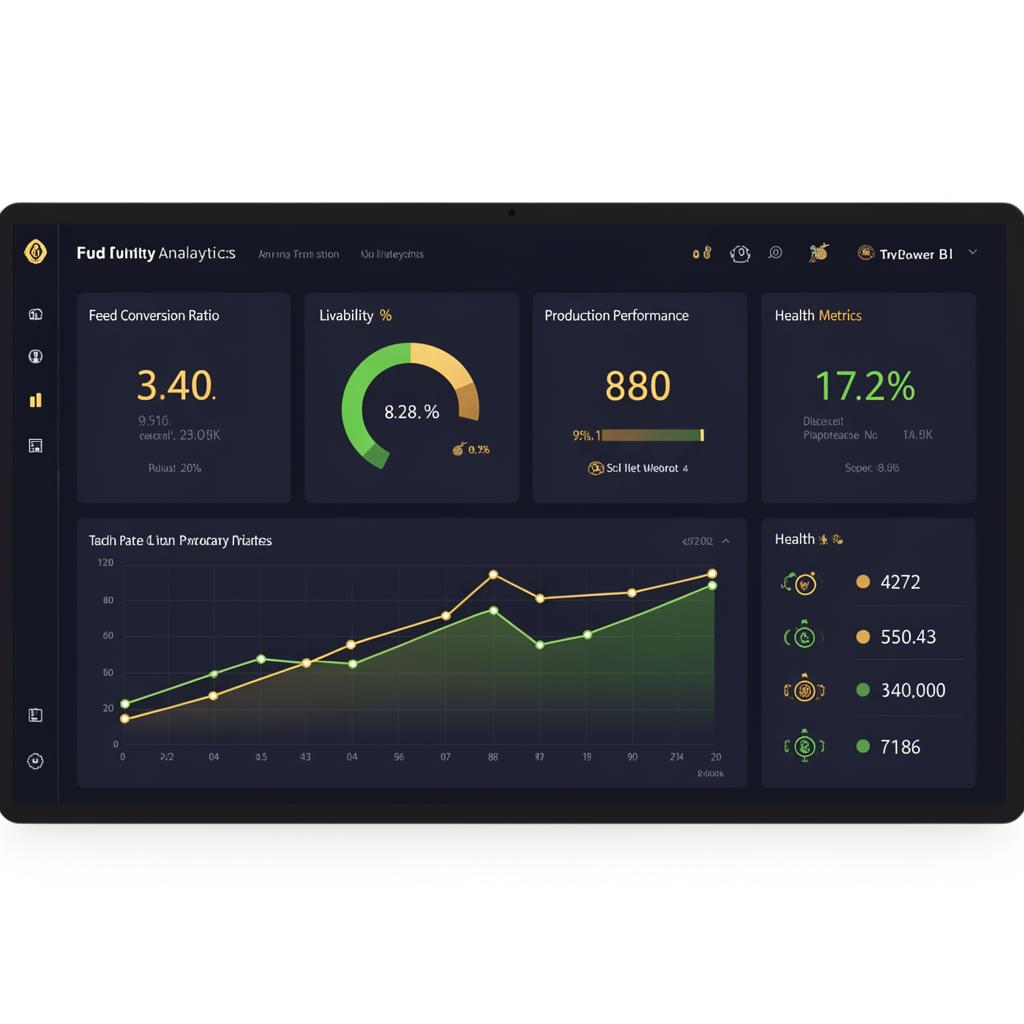
Poultry Performance Dashboard
Flock-level performance intelligence for a broiler and layer operation — feed conversion, livability and health metrics in one place.
The Problem
- Flock records reviewed only at depopulation — too late to act.
- Feed conversion calculated manually with frequent errors.
- No clear link between health interventions and production outcomes.
The Approach
- Built a flock-tracking data model from placement to processing.
- Automated FCR, livability and production performance calculations.
- Linked health and vaccination logs to performance drops.
- Delivered weekly flock scorecards for production managers.
Key KPIs Tracked
Feed Conversion
FCR per flock & house
Livability
% survival vs. standard
Production
Eggs / weight gain vs. target
Health Metrics
Vaccination & mortality causes
Results
- Early-warning alerts on underperforming flocks within the first 14 days.
- Measurable improvement in feed conversion and livability.
- Health interventions evaluated on production impact, not anecdote.
Have a similar challenge?